Dashboard / Daily Stats
5 articles
The Calendar View shows your daily profit and loss in a clear, visual format.
Each day displays:
- Total profit or loss (P/L)
- Number of trades executed
-
Color coding:
- Green — profitable day
- Red — losing day
- Gray — no trades
This view helps you quickly identify strong trading days, weak periods,
and patterns in your overall performance.
You can customize both the Dashboard and the
Trading Log using the Customize button.
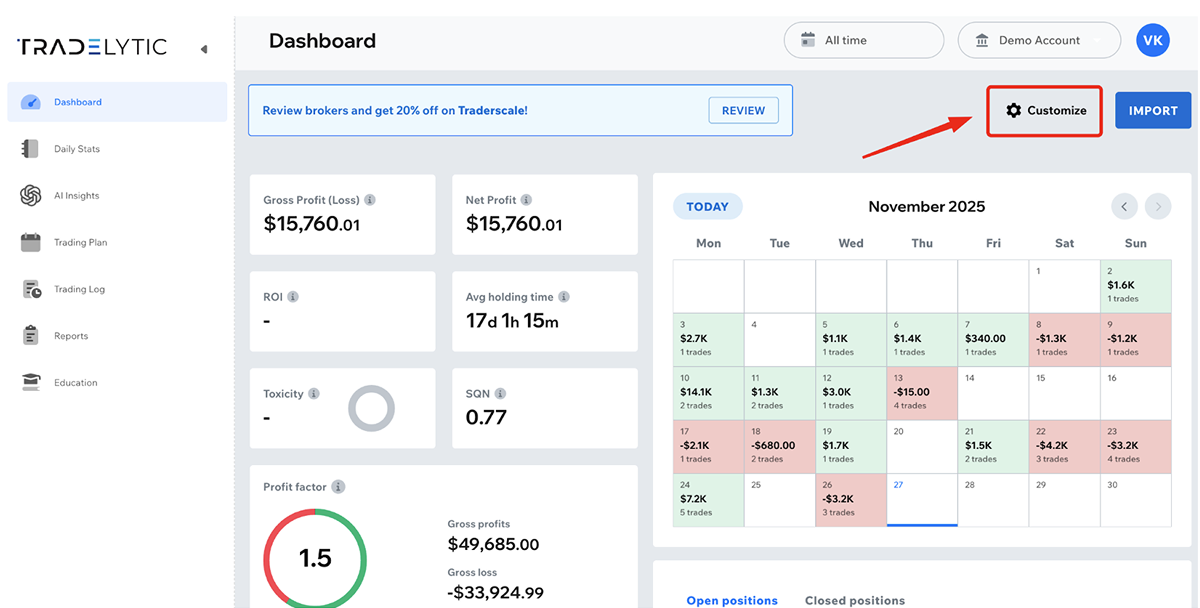
This allows you to:
- Show or hide specific metrics
- Adjust visible widgets and data blocks
- Tailor the interface to your personal trading style
Customization helps you focus only on the information that matters most
for your analysis and decision-making.
In the Trading Log and Daily Stats, every
column header is sortable.
To change the sorting order, simply click on a column name such as:
- Open Time
- Symbol
- Type
- Volume
Clicking once sorts the data in ascending order, and clicking again
reverses it to descending order.
This makes it easy to analyze your trades from different perspectives,
such as time sequence, instrument performance, or position size.
Gross Profit (or Loss) represents the raw profit or loss
of a trade before any deductions.
Net Profit shows the final result after subtracting all
commissions and fees charged by the broker.
- Gross Profit = trade P/L before commissions and fees
- Net Profit = trade P/L after commissions and fees
If no commissions or fees are recorded for a trade, Gross Profit and
Net Profit will be identical.
Commissions may appear as “–” when commission data is not
available for a trade.
This usually happens when:
-
Your account uses a spread-only model, where trading costs
are included in the spread and no separate commission is charged - Your broker does not include commission values in MT4/MT5 reports
- The imported file did not contain commission data
- The account type does not track commissions or fees
- The trade was synced without commission information
This is normal behavior and does not affect your profit or
loss calculations.
